For infrastructure investors and lenders

Find the infrastructure risk in every asset you finance

The Bundle ranks which assets have the least room to adapt if power, land, or roads get harder to obtain, and an AI analyst cites the data behind each result.

Northern Virginia · fictional portfolio

“Of the three sites, Potomac Compute Campus has the least room to adapt.”
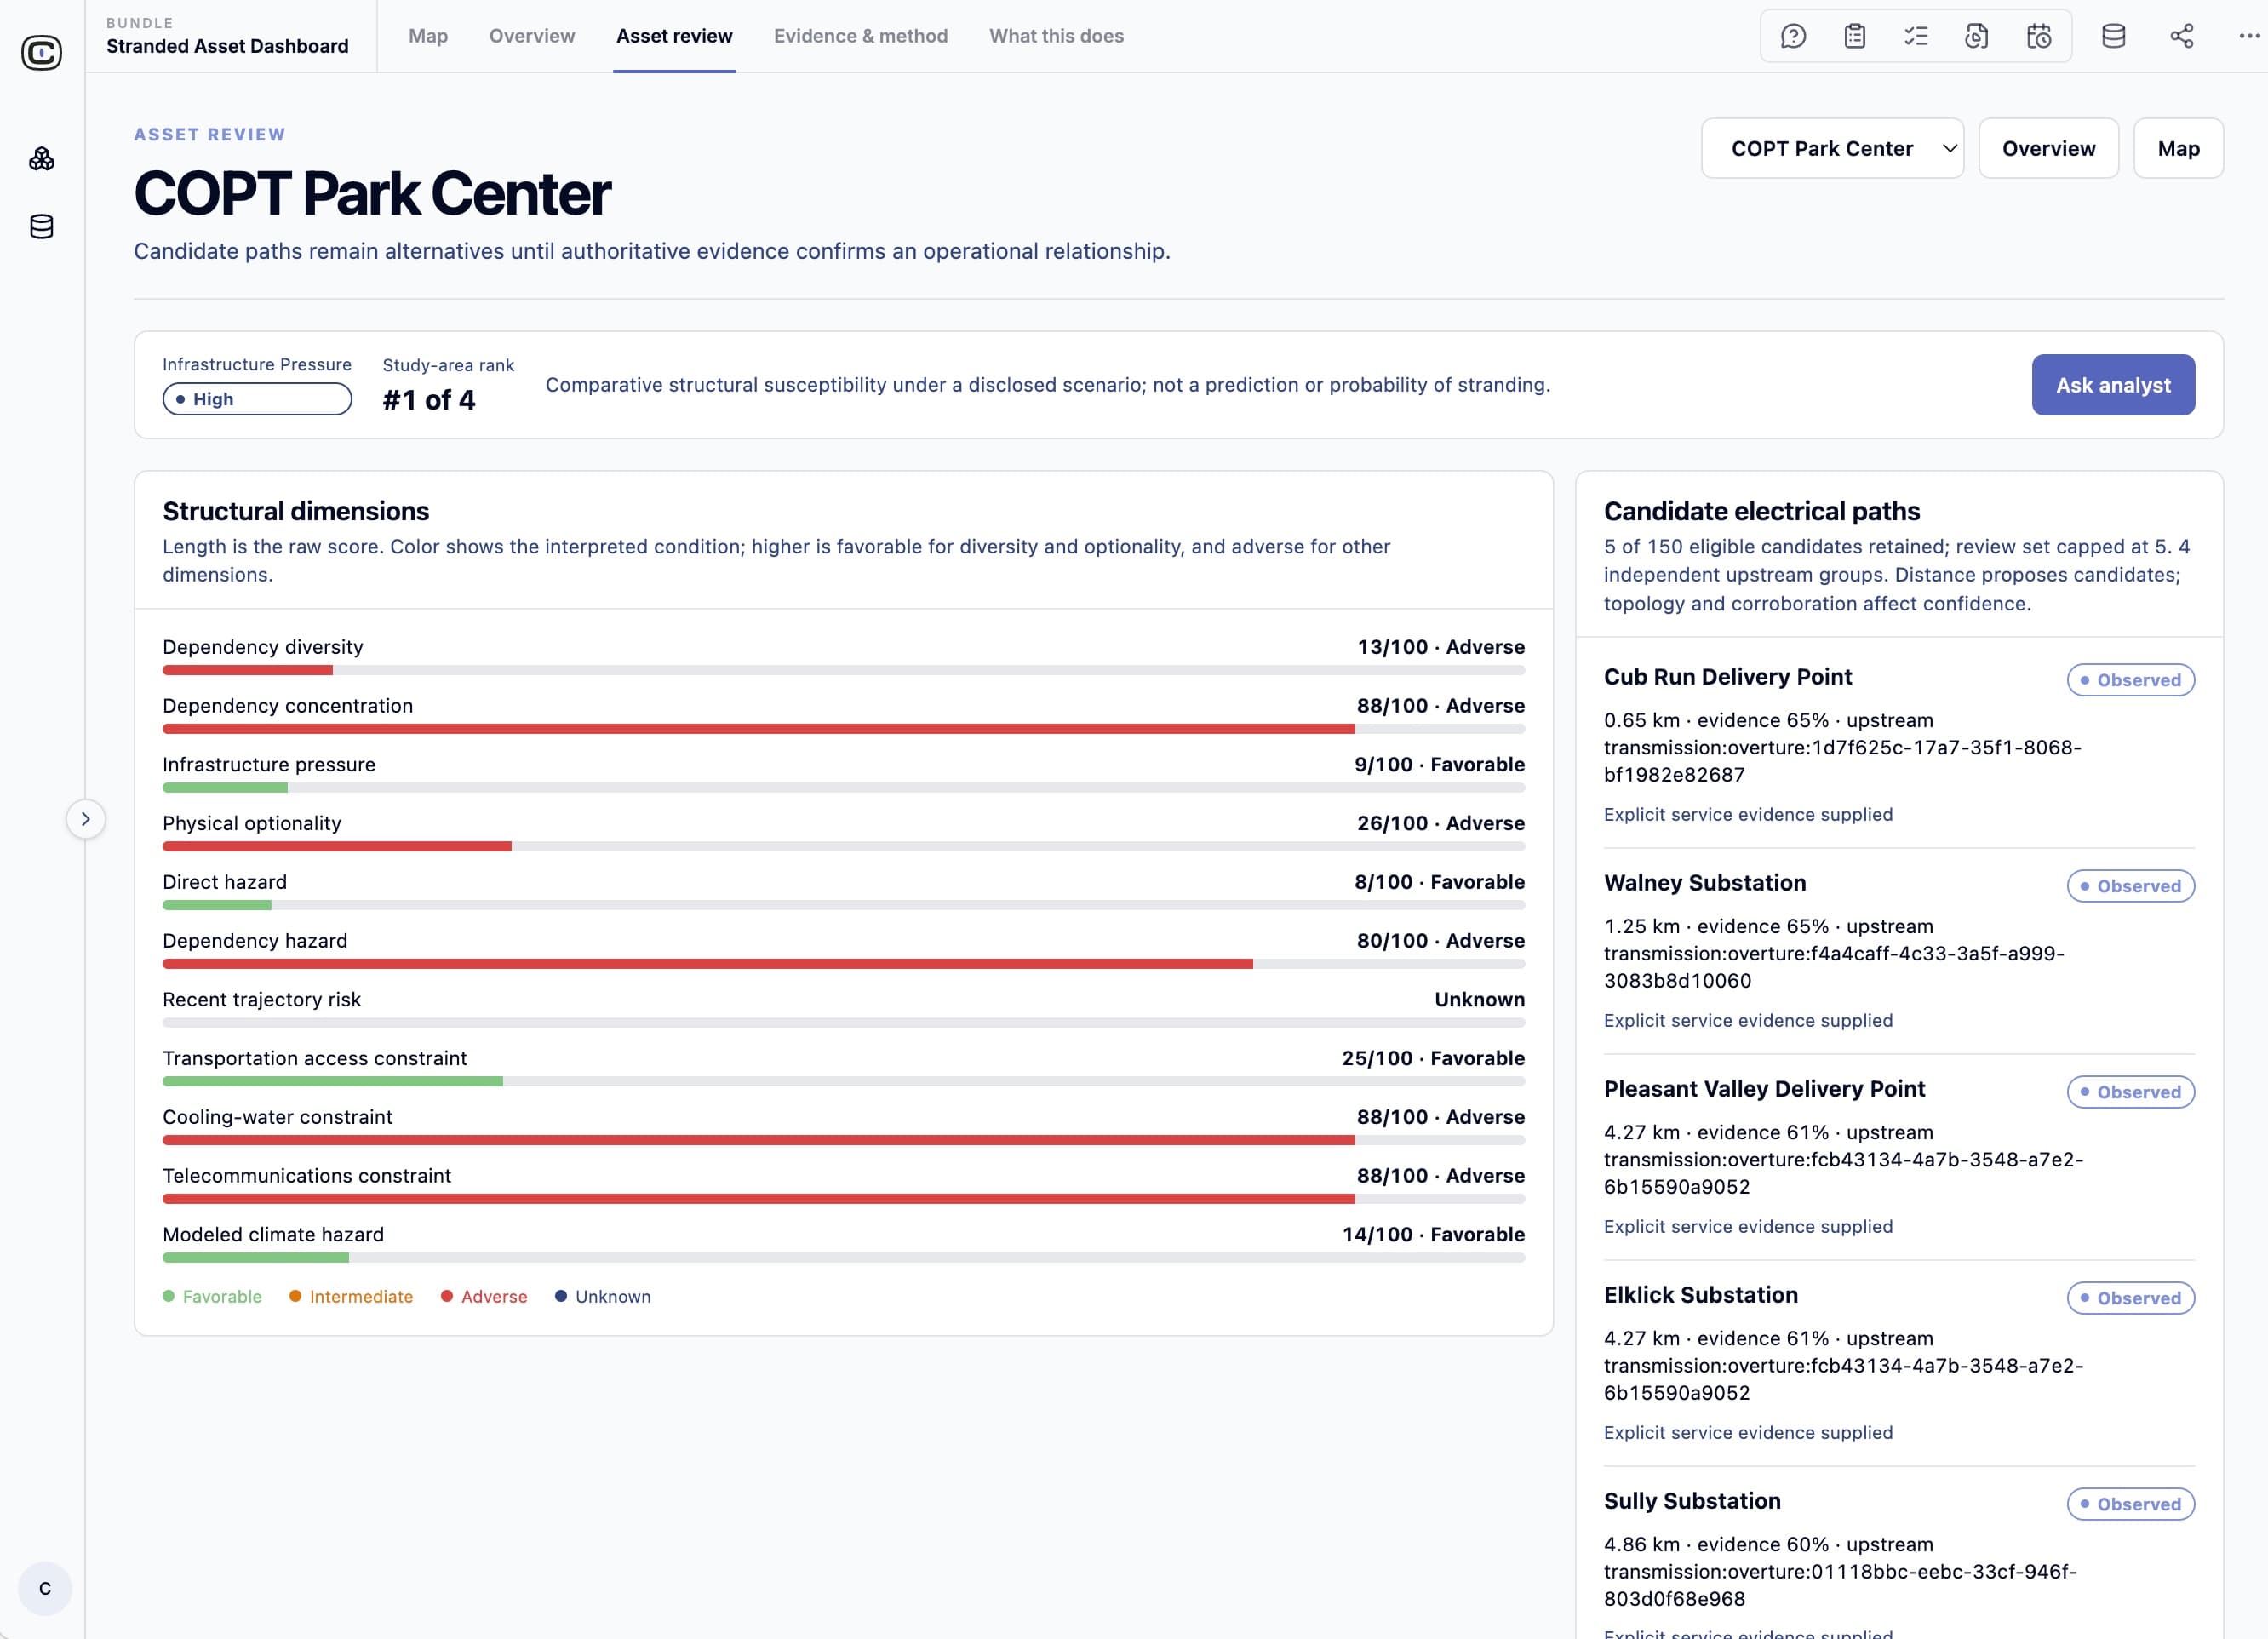
  • Possible substations3
  • On the same corridor2
  • Grid demand growth8.8%
  • Open land nearby11%
Ranked against the other two sites in the study area.
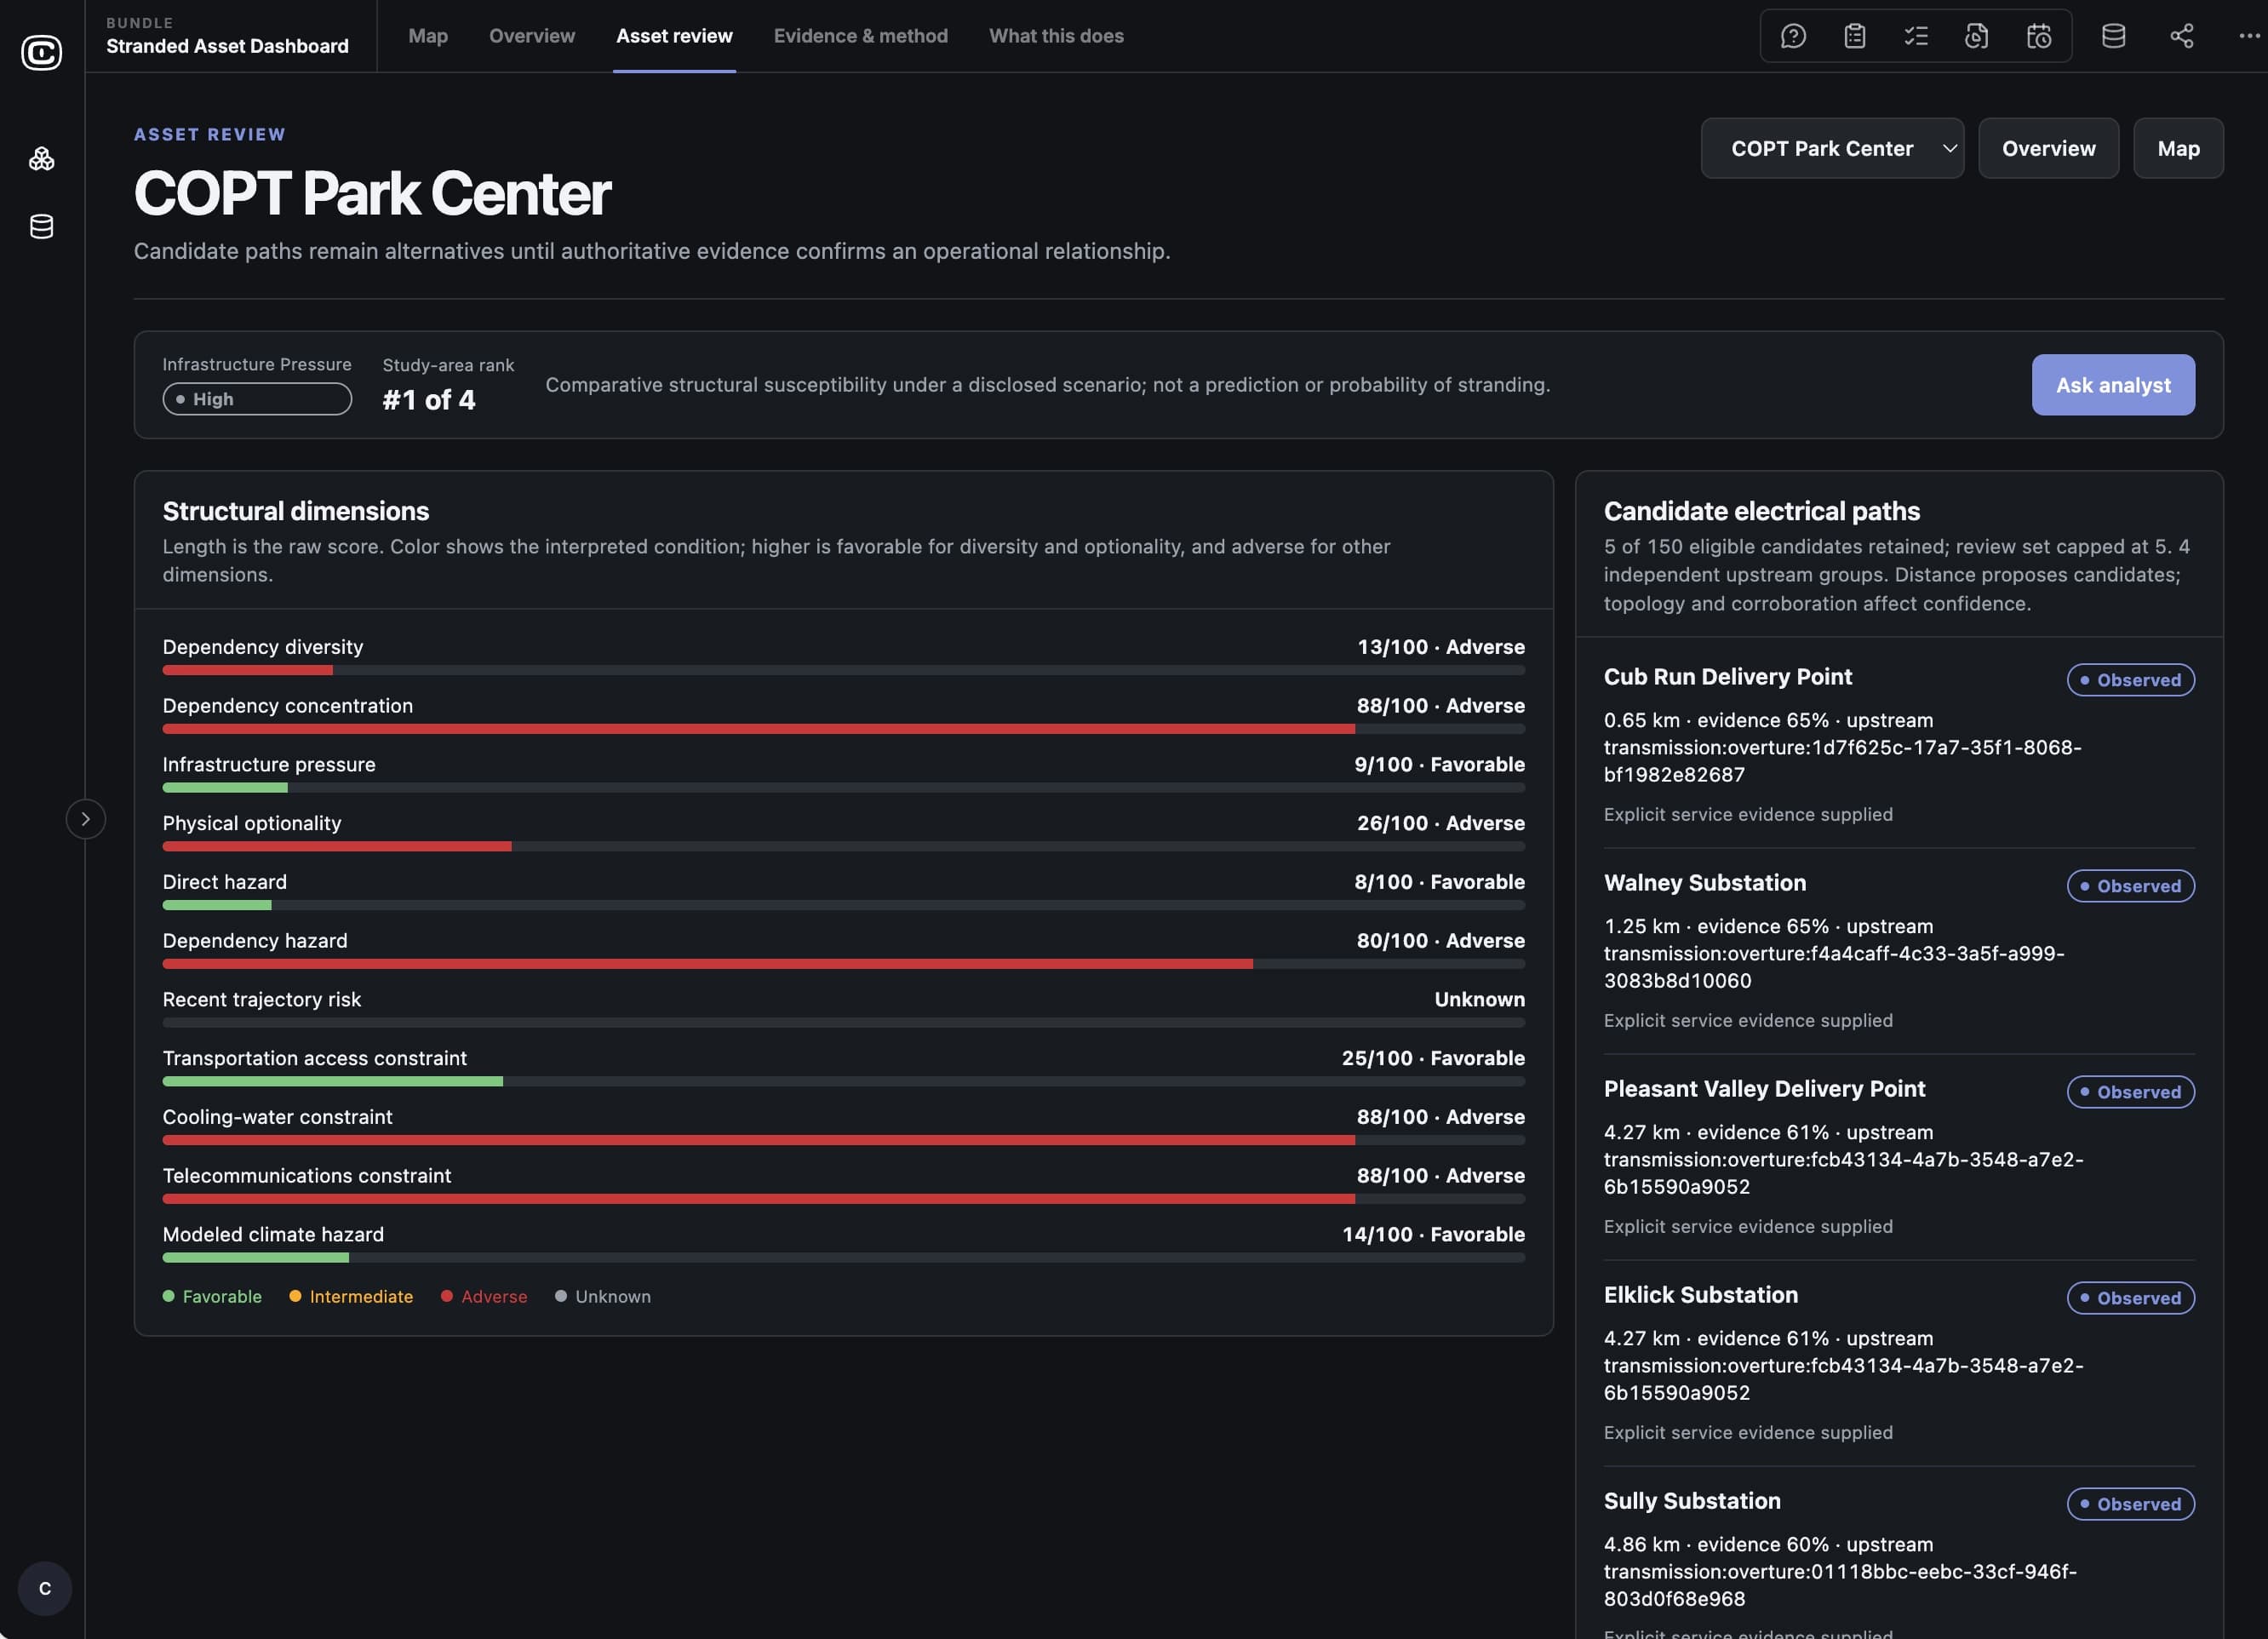
Asset review showing structural measurements and candidate power connections for one data center

Each result is built from facts you can check.

The Bundle measures the infrastructure around each asset, compares the assets with each other, and records the source of every figure.

Northern Virginia · Potomac Compute Campus

3

Possible substations

Two of them are on the same transmission corridor, so a problem on that corridor could affect both.

Overture power infrastructure

2

Substations other sites could use

Bravo and Charlie Substations are also possible power sources for the other two data centers.

Overture power infrastructure

8.8%

Growth in grid demand

Electricity demand in the region grew 8.8% from a year earlier, while generation grew 1.9%.

EIA grid data

11%

Open land nearby

The largest open area is 7 hectares, and one road leads to the site. The other two sites have 37% and 62%.

Overture land use and roads

Compare assets side by side.

Each asset gets a class from Very Low to Very High, plus a separate rating of how strong the evidence is, so a result with little evidence behind it is labeled that way.

Northern Virginia · fictional portfolio

Potomac Compute Campus

Shared power paths and little open land

ClassVery High
EvidenceModerate
Possible substations3on 2 corridors
Open land nearby11%

Piedmont Cloud Exchange

Conditions in the area getting worse, offset by open land

ClassModerate
EvidenceModerate
Possible substations2on 2 corridors
Open land nearby62%

Blue Ridge Digital Park

Separate power paths, but limited evidence

ClassLow
EvidenceLow
Possible substations2on 2 corridors
Open land nearby37%

How the class works

Classes come from an internal score: 75 and above is Very High, 60 High, 40 Moderate, 25 Low, and below 25 Very Low.

See which substations each asset could draw power from.

The Bundle proposes possible power sources for each asset from distance and mapped transmission lines, and rates how strong each match is. A nearby substation is never treated as confirmed service.

Northern Virginia · seven possible connections to five substations

North corridorPotomac Compute CampusBlue Ridge Digital ParkPiedmont Cloud ExchangeAlpha SubstationNorth corridorBravo SubstationNorth corridorCharlie SubstationEast corridorDelta SubstationWest corridorEcho SubstationSouth corridor
Strong matchModerate matchSubstation more than one site could draw on

Connect the records public maps can’t reach.

Clairvoyint brings utility, carrier, and land records into the same analysis as the public map data, so each result reflects what your team knows.

  • Utility service recordsWhich substation actually serves each site
  • Utility capacity data and site meteringSpare substation capacity and each site’s own power demand
  • Carrier fiber route dataWhether a site has separate fiber routes
  • Water utility and operator recordsWater service, cooling technology, and water rights
  • County land and permit recordsOwnership, zoning, and permits needed to expand

Use the same method for your own assets.

Choose an area on the map or add your own asset list, and the Bundle runs the same calculations and AI analyst on it.

  1. 01

    Choose an area or add your assets

    Zoom the map to an area and choose Analyze this area, or replace the sample asset list with your own. Each run records exactly which data it used.

    OpenStreetMap · Overture · EIA · FEMA flood zones

  2. 02

    Document how your team decides

    Set the scenario weights, search distances, and what counts as missing data. The calculations run as code you can read, rather than as an estimate from an AI model.

    Scenario rules · scoring rules · power-matching rules

  3. 03

    Get assessments that cite their sources

    Comparisons, asset reviews, and written interpretations that cite every input and list the data that would change the result.

    Map · overview · asset review · evidence and method

data sources
7
data sources
weighted measurements
10
weighted measurements
AI analyst agent
1
AI analyst agent
dashboard views
5
dashboard views
Early access

Use this Bundle with your own data.

Tell us which assets or regions you need to assess. Join the beta and we’ll help you set up the Bundle with your data.

Examples use public, modeled, or fictional data. Results are research and are not investment, trading, betting, or operational advice or forecasts.