For shipping, logistics, and operations teams

AI analysis built for geospatial operations

Decide whether a route or site is still worth using, and see the evidence behind the decision.

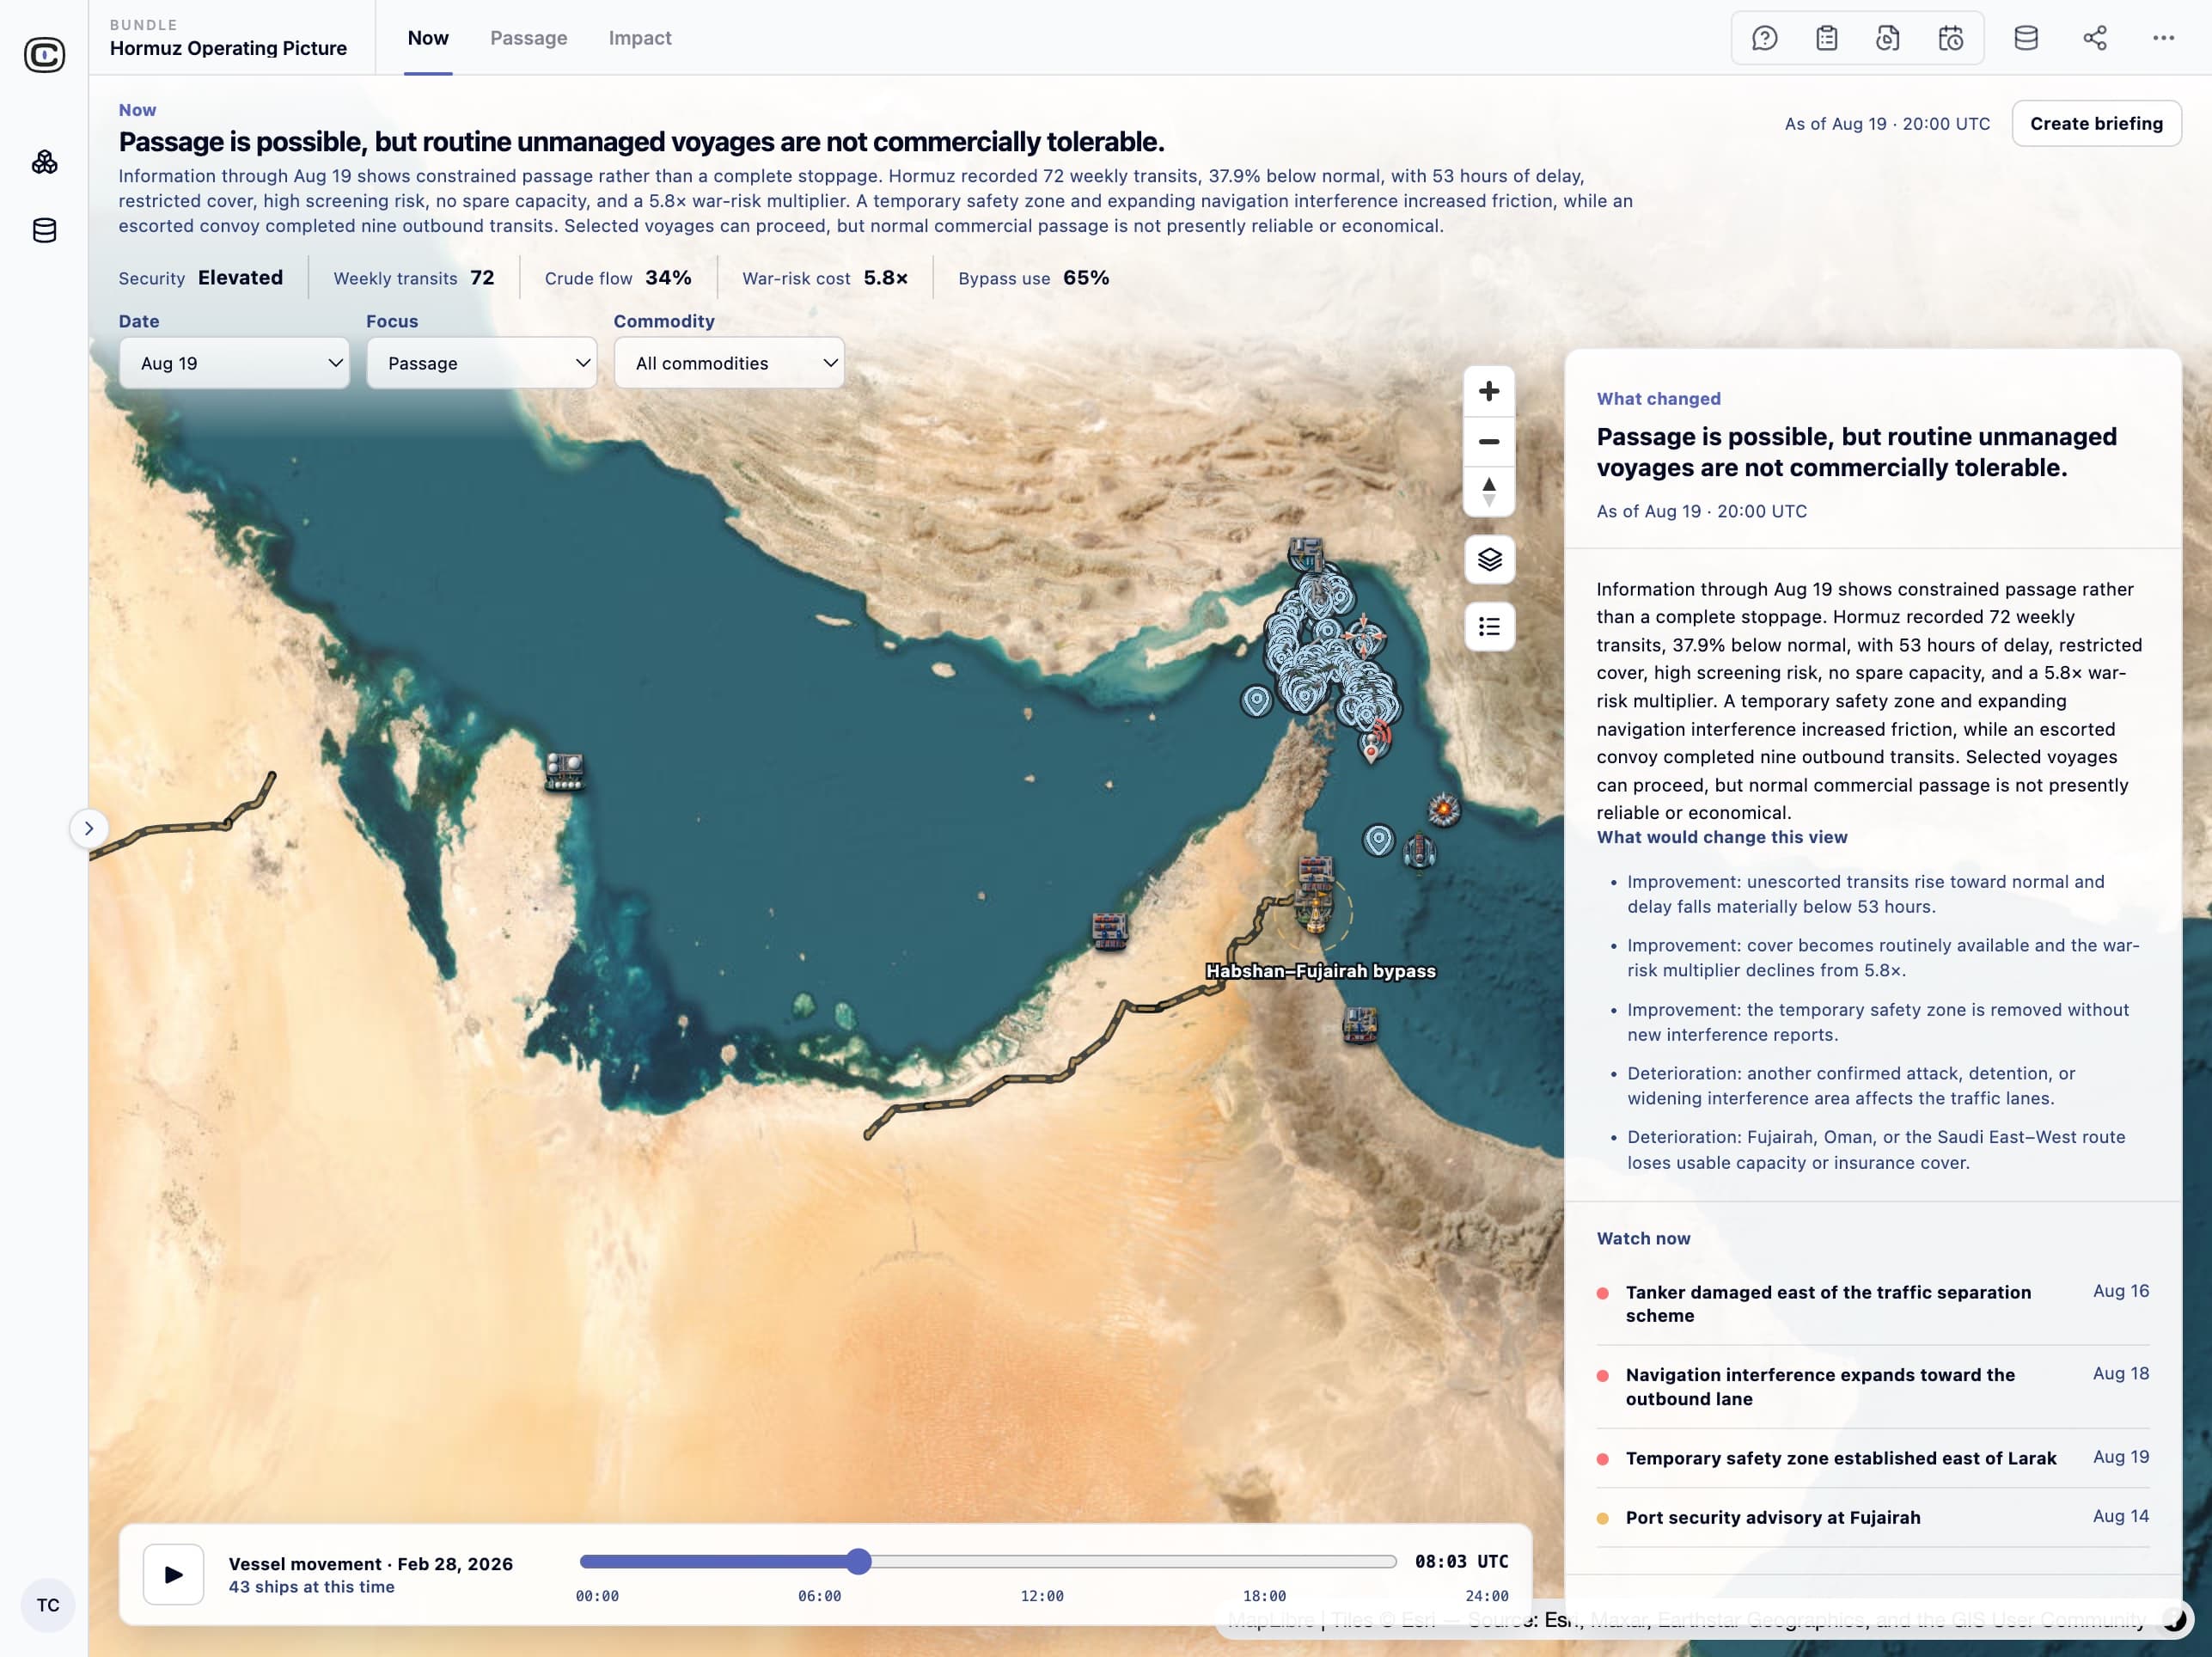
Strait of Hormuz · modeled scenario

“Passage is possible, but routine unmanaged voyages are not commercially tolerable.”
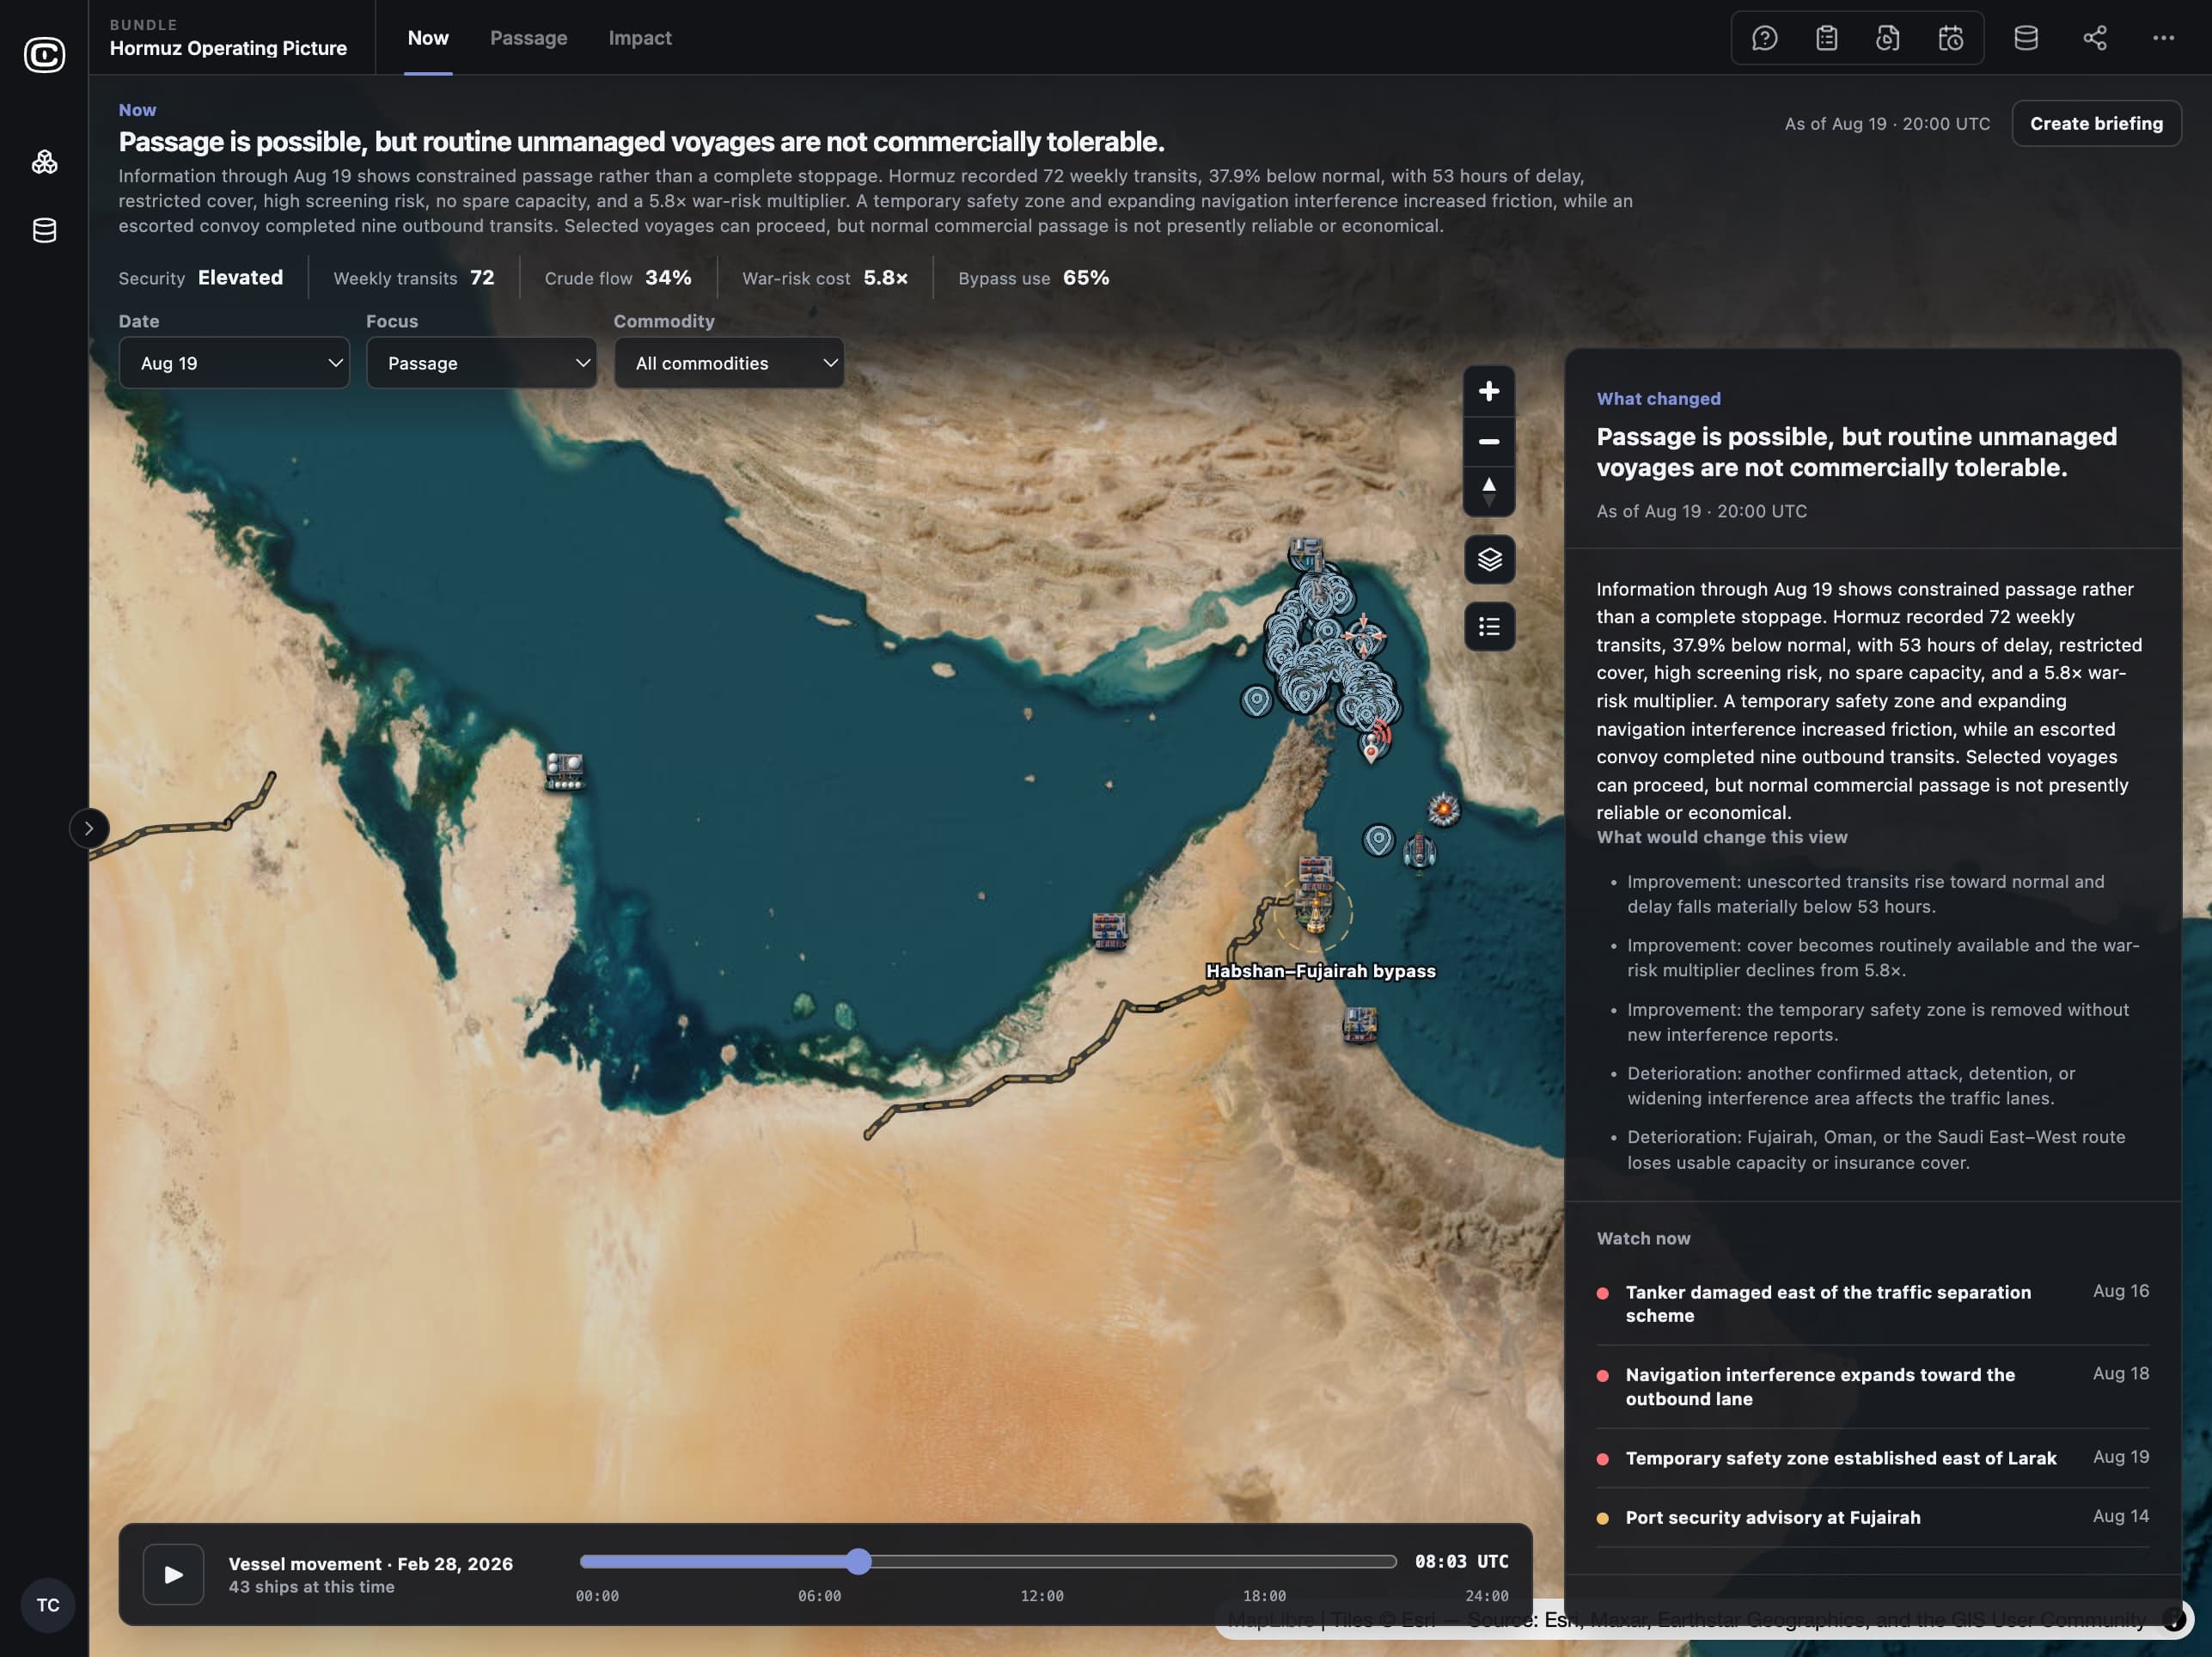
  • SecurityElevated
  • War-risk5.8×
  • Delay53 hrs
  • Transits72 / wk
Written by the Bundle’s analyst agent from seven data sources, each one cited.
Shipping routes and operating conditions around the Strait of Hormuz

Each assessment is based on measurements you can check.

The Bundle tracks the measurements that decide whether an operation is worth running, each with its source.

Strait of Hormuz · modeled scenario

72

Weekly transits

37.9% below normal through the Strait

Transit counts

53 hrs

Transit delay

About two days added to each voyage schedule

Route delays

5.8×

War-risk premium

Times the normal premium; insurers review each voyage

Insurance and freight rates

34%

Crude flow

Of normal volume through the main corridor

Energy market data

65%

Bypass facility use

Average use of the alternative ports and pipelines

Facility capacity

Compare the alternatives side by side.

Each route or site shows its cost, capacity, delay, insurance cover, and risk as separate values, so you can see which value caused a poor status.

Strait of Hormuz · the main corridor vs. three bypass routes

Strait passage

Main shipping lanes through the Strait

War-risk (× normal)5.8×
Freight (× normal)4.8×
Delay53 h
Spare capacity47%
Insurance coverRestricted
Sanctions screeningHigh

Habshan–Fujairah bypass

Pipeline to Fujairah, outside the Strait

War-risk (× normal)1.6×
Freight (× normal)1.7×
Delay18 h
Spare capacity75%
Insurance coverAvailable
Sanctions screeningElevated

Saudi East–West route

Pipeline to Yanbu on the Red Sea

War-risk (× normal)1.4×
Freight (× normal)1.5×
Delay20 h
Spare capacity70%
Insurance coverCase-by-case
Sanctions screeningElevated

Oman & Duqm route

Ports and refinery outside the Gulf

War-risk (× normal)1.3×
Freight (× normal)1.4×
Delay14 h
Spare capacity61%
Insurance coverAvailable
Sanctions screeningElevated

How status is set

A route is open above 80% of normal transits, constrained from 40% to 80%, and severely constrained below 40%. When capacity data is missing, the status is shown as unknown.

See who depends on the affected area.

The Bundle lists the countries, customers, or facilities that depend on the affected area, how much of their supply passes through it, and how many days of inventory they hold.

Strait of Hormuz · who relies on cargo moving through it

Least inventory

Northwest Europe holds 2.0 days of petrochemical inventory, and its shipments are delayed by 9 days.

It would run out of supply a week before its delayed shipments arrive.

  • Japan

    LNG

    43%

    6.3days

    +5days

  • South Korea

    Crude oil

    39%

    5.1days

    +6days

  • China

    LPG

    36%

    4.5days

    +8days

  • India

    Crude oil

    31%

    3.7days

    +7days

  • Northwest Europe

    Petrochemicals

    22%

    2.0days

    +9days

Dependencies are estimated from UN Comtrade public trade data, or from your own customer and contract data.

Each assessment lists what to check next.

Each assessment ends with the changes that would improve or worsen it, so the next review starts there.

Strait of Hormuz · modeled scenario

Recent incidents

  • Tanker damaged east of the traffic separation schemeDay 1
  • Navigation interference expands toward the outbound laneDay 3
  • Temporary safety zone established east of LarakDay 4
  • Escorted convoy completes nine outbound transitsDay 4

Would improve the assessment

  • Unescorted transits stay above 80% of normal for two consecutive days.
  • Insurers offer war-risk cover without reviewing each voyage, and the premium falls below 5.8 times normal.
  • The temporary safety zone is removed and no new interference is reported.

Would worsen the assessment

  • Another attack or detention is confirmed, or the interference area expands into the shipping lanes.
  • Fujairah, Oman, or the Saudi East–West route loses usable capacity or insurance cover.
  • The Strait is closed or a major terminal stops operating.

Use the same method for your own routes, sites, and regions.

Clairvoyint records how your team analyzes a location: the data it uses, the calculations it runs, and the judgments it makes. It then runs that analysis as an AI agent that cites its sources. Add your own sites, routes, and sources, and the same calculations and agents run on them.

  1. 01

    Add your data

    Incident reports, vessel or vehicle positions, imagery, sensor feeds, facility and asset lists, and cost or market data. Replace the sample files with live feeds, and the calculations and views stay the same.

    GeoJSON · AIS · imagery · sensor feeds · CSV

  2. 02

    Document how your team decides

    Record your thresholds, your comparisons, and what counts as missing data. The calculations run as code you can read, rather than as an estimate from an AI model.

    Calculation scripts · rules · reference notes

  3. 03

    Get assessments that cite their sources

    Briefings, answers to your questions, and planning scenarios that cite every number and list the changes that would alter the conclusion.

    Briefings · questions and answers · scenarios · exports

data sources
6
data sources
calculations
6
calculations
AI analyst agents
4
AI analyst agents
dashboard views
3
dashboard views
Early access

Use this Bundle with your own data.

Tell us which route, site, or region you need to assess. Join the beta and we’ll help you set up the Bundle with your data.

Examples use public, modeled, or fictional data. Results are research and are not investment, trading, betting, or operational advice or forecasts.